

New York, New York (Issue #7)
The adventures of summer '23

Hello! 👋
I spent this past summer in New York, working for NYC Department of City Planning Data Engineering as part of the Coding It Forward fellowship. It was an awesome experience that taught me a lot, especially about how to approach data science work in government. I got to meet a ton of cool people, learn some tools of the trade, and get to know New York from its data. More on our project on our Demo Day presentation here as well a Medium post coming up soon.
While the work was really informative, getting to explore New York was just as cool! For this issue, I’ll take you through some of my explorations, random interesting findings and (of course) favorite coffee spots in the City. Three months and 29 coffee shops later, here are some of my reflections. ☕️
🏦 Lower Manhattan: the Equitable Building, a centuries-old grid and “Black Fox”
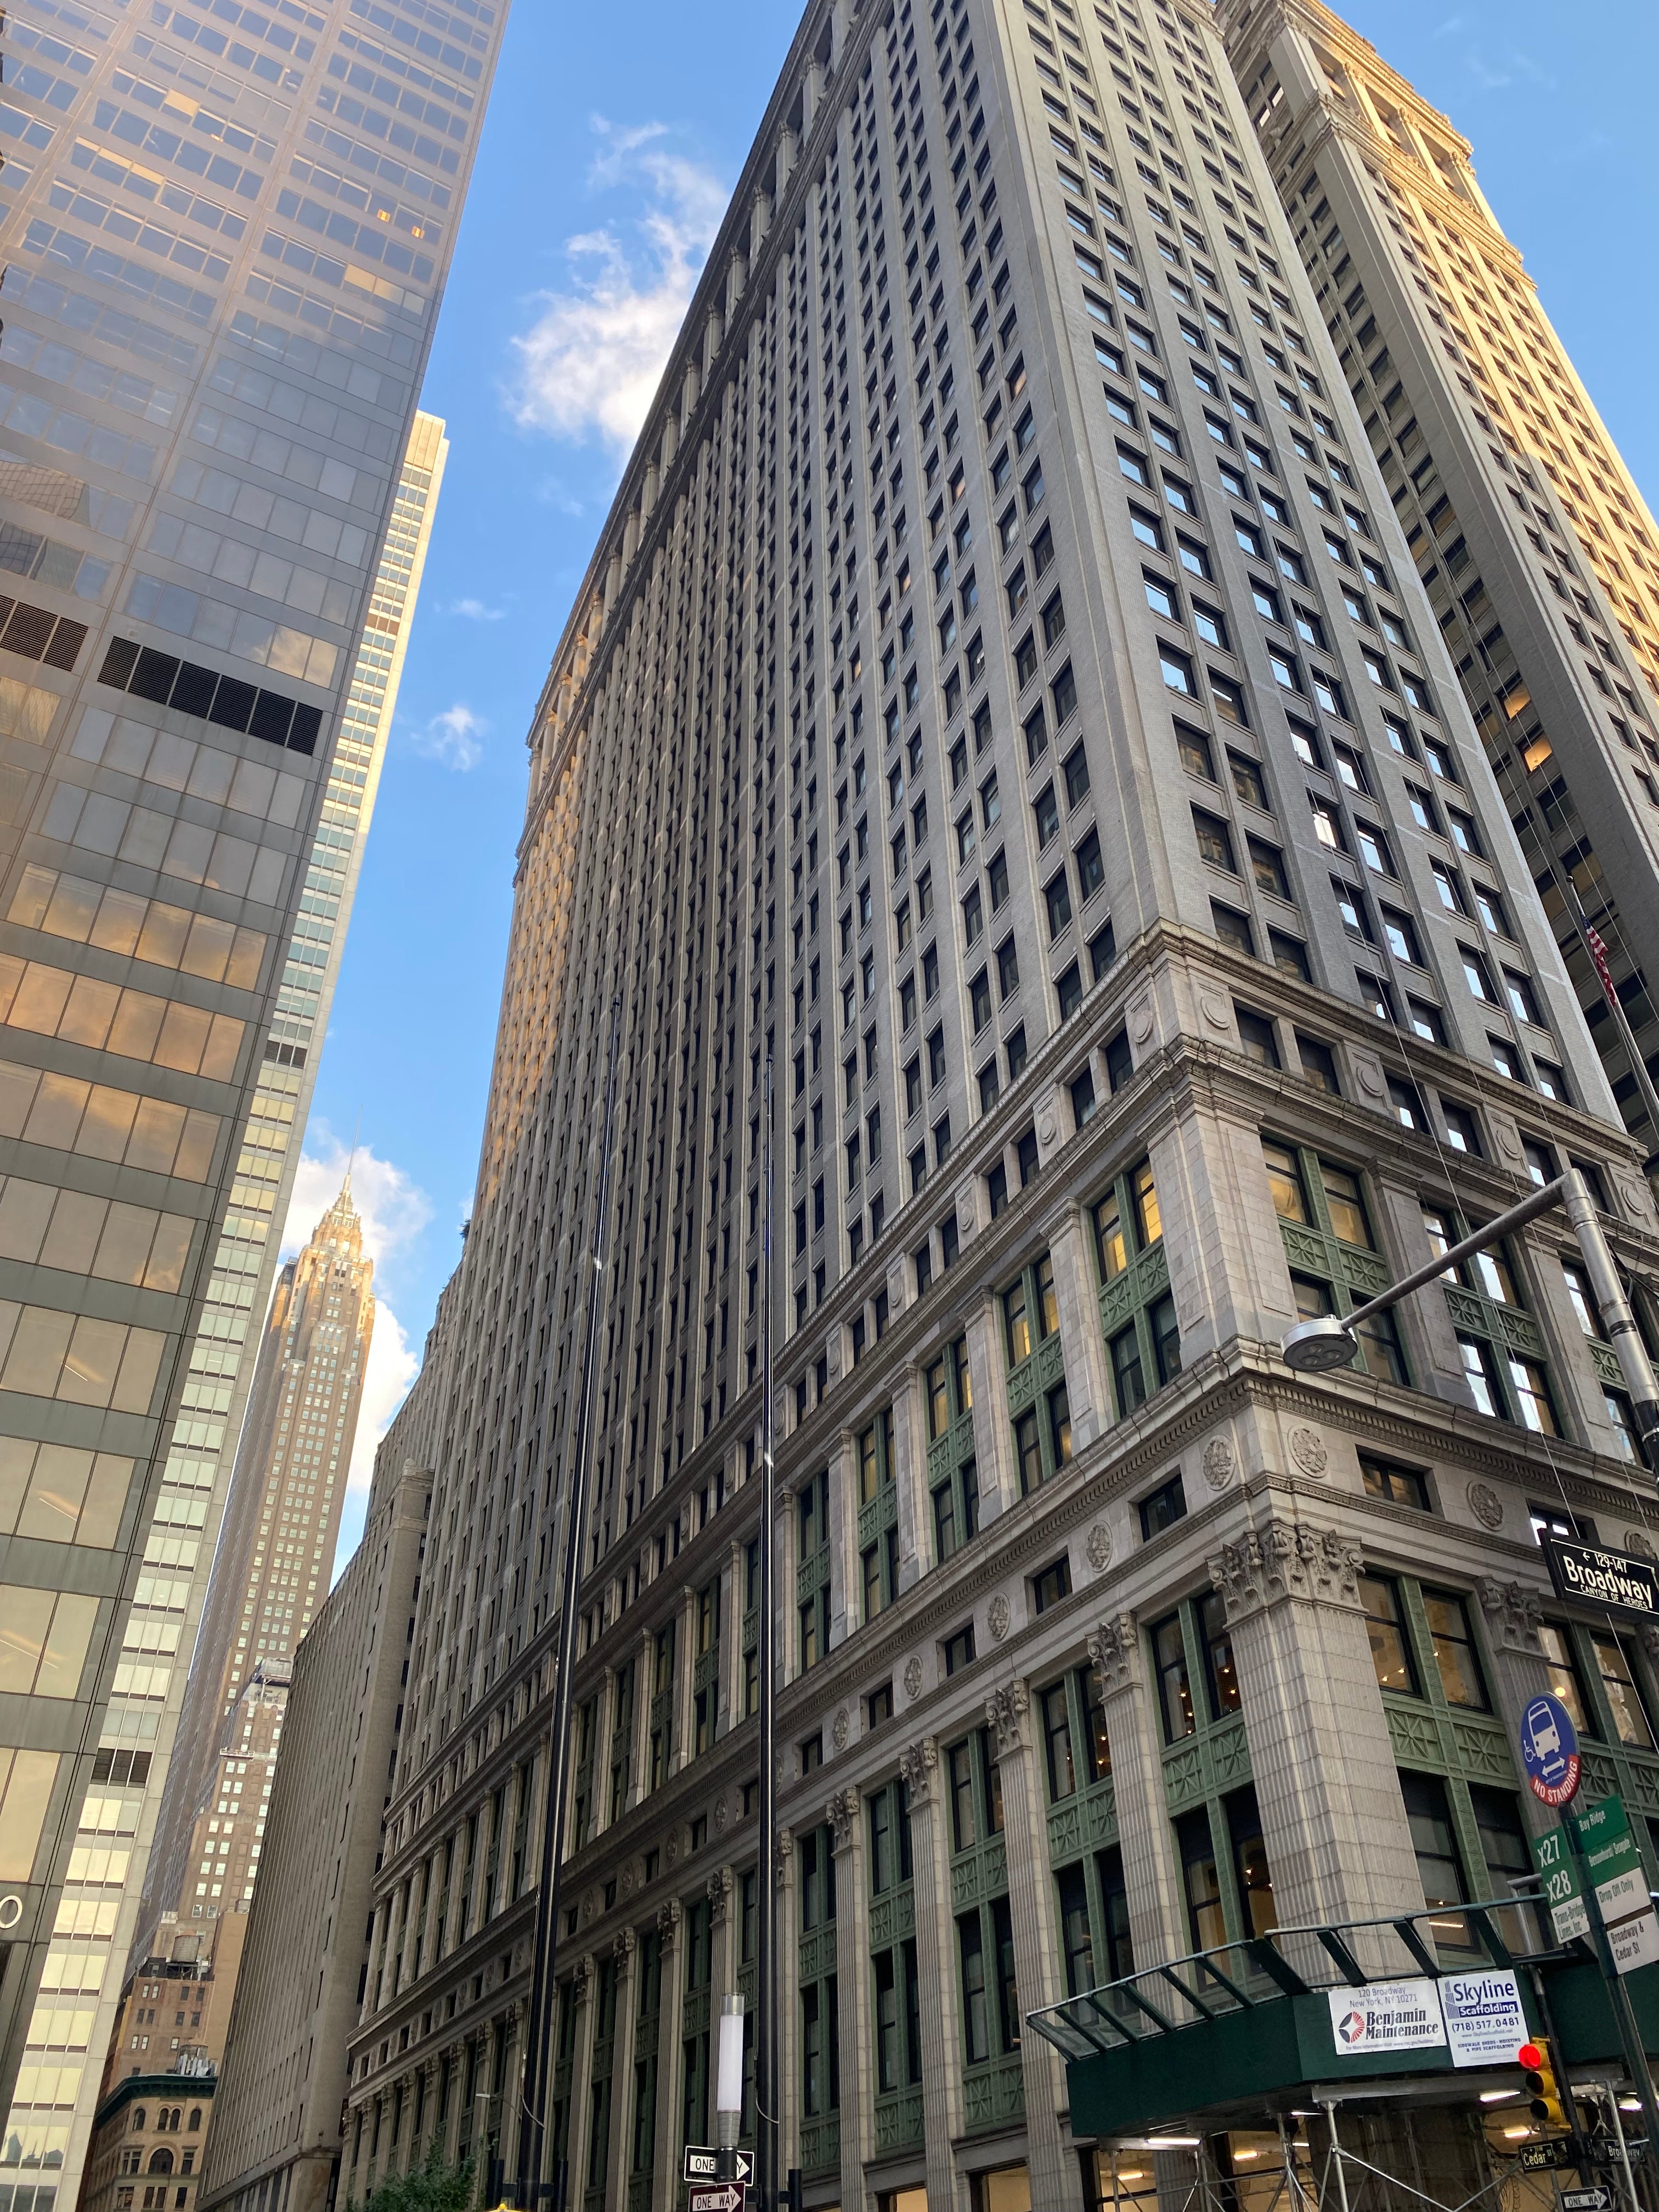
As a City Planning fellow, my adventure began in 120 Broadway, also known as the Equitable Building. A neoclassical imposing structure built in 1913, the Equitable Building houses the Department of City Planning and a few bits of urban planning history as well. Due to its structure, the building blocked sunlight from reaching the surrounding area and this was part of what led to the City’s first zoning ordinance: the 1916 Zoning Resolution. This new ordinance limited the maximum height of buildings to around 25% of their lot sizes and had enormous impacts to how cities developed in the US and beyond from that point. Here’s what the building looks like from the ground today:
Inside, the Equitable building has even more planning-related Easter eggs. For instance, our department had this original map of the Island of Manhattan from 1800 on display:
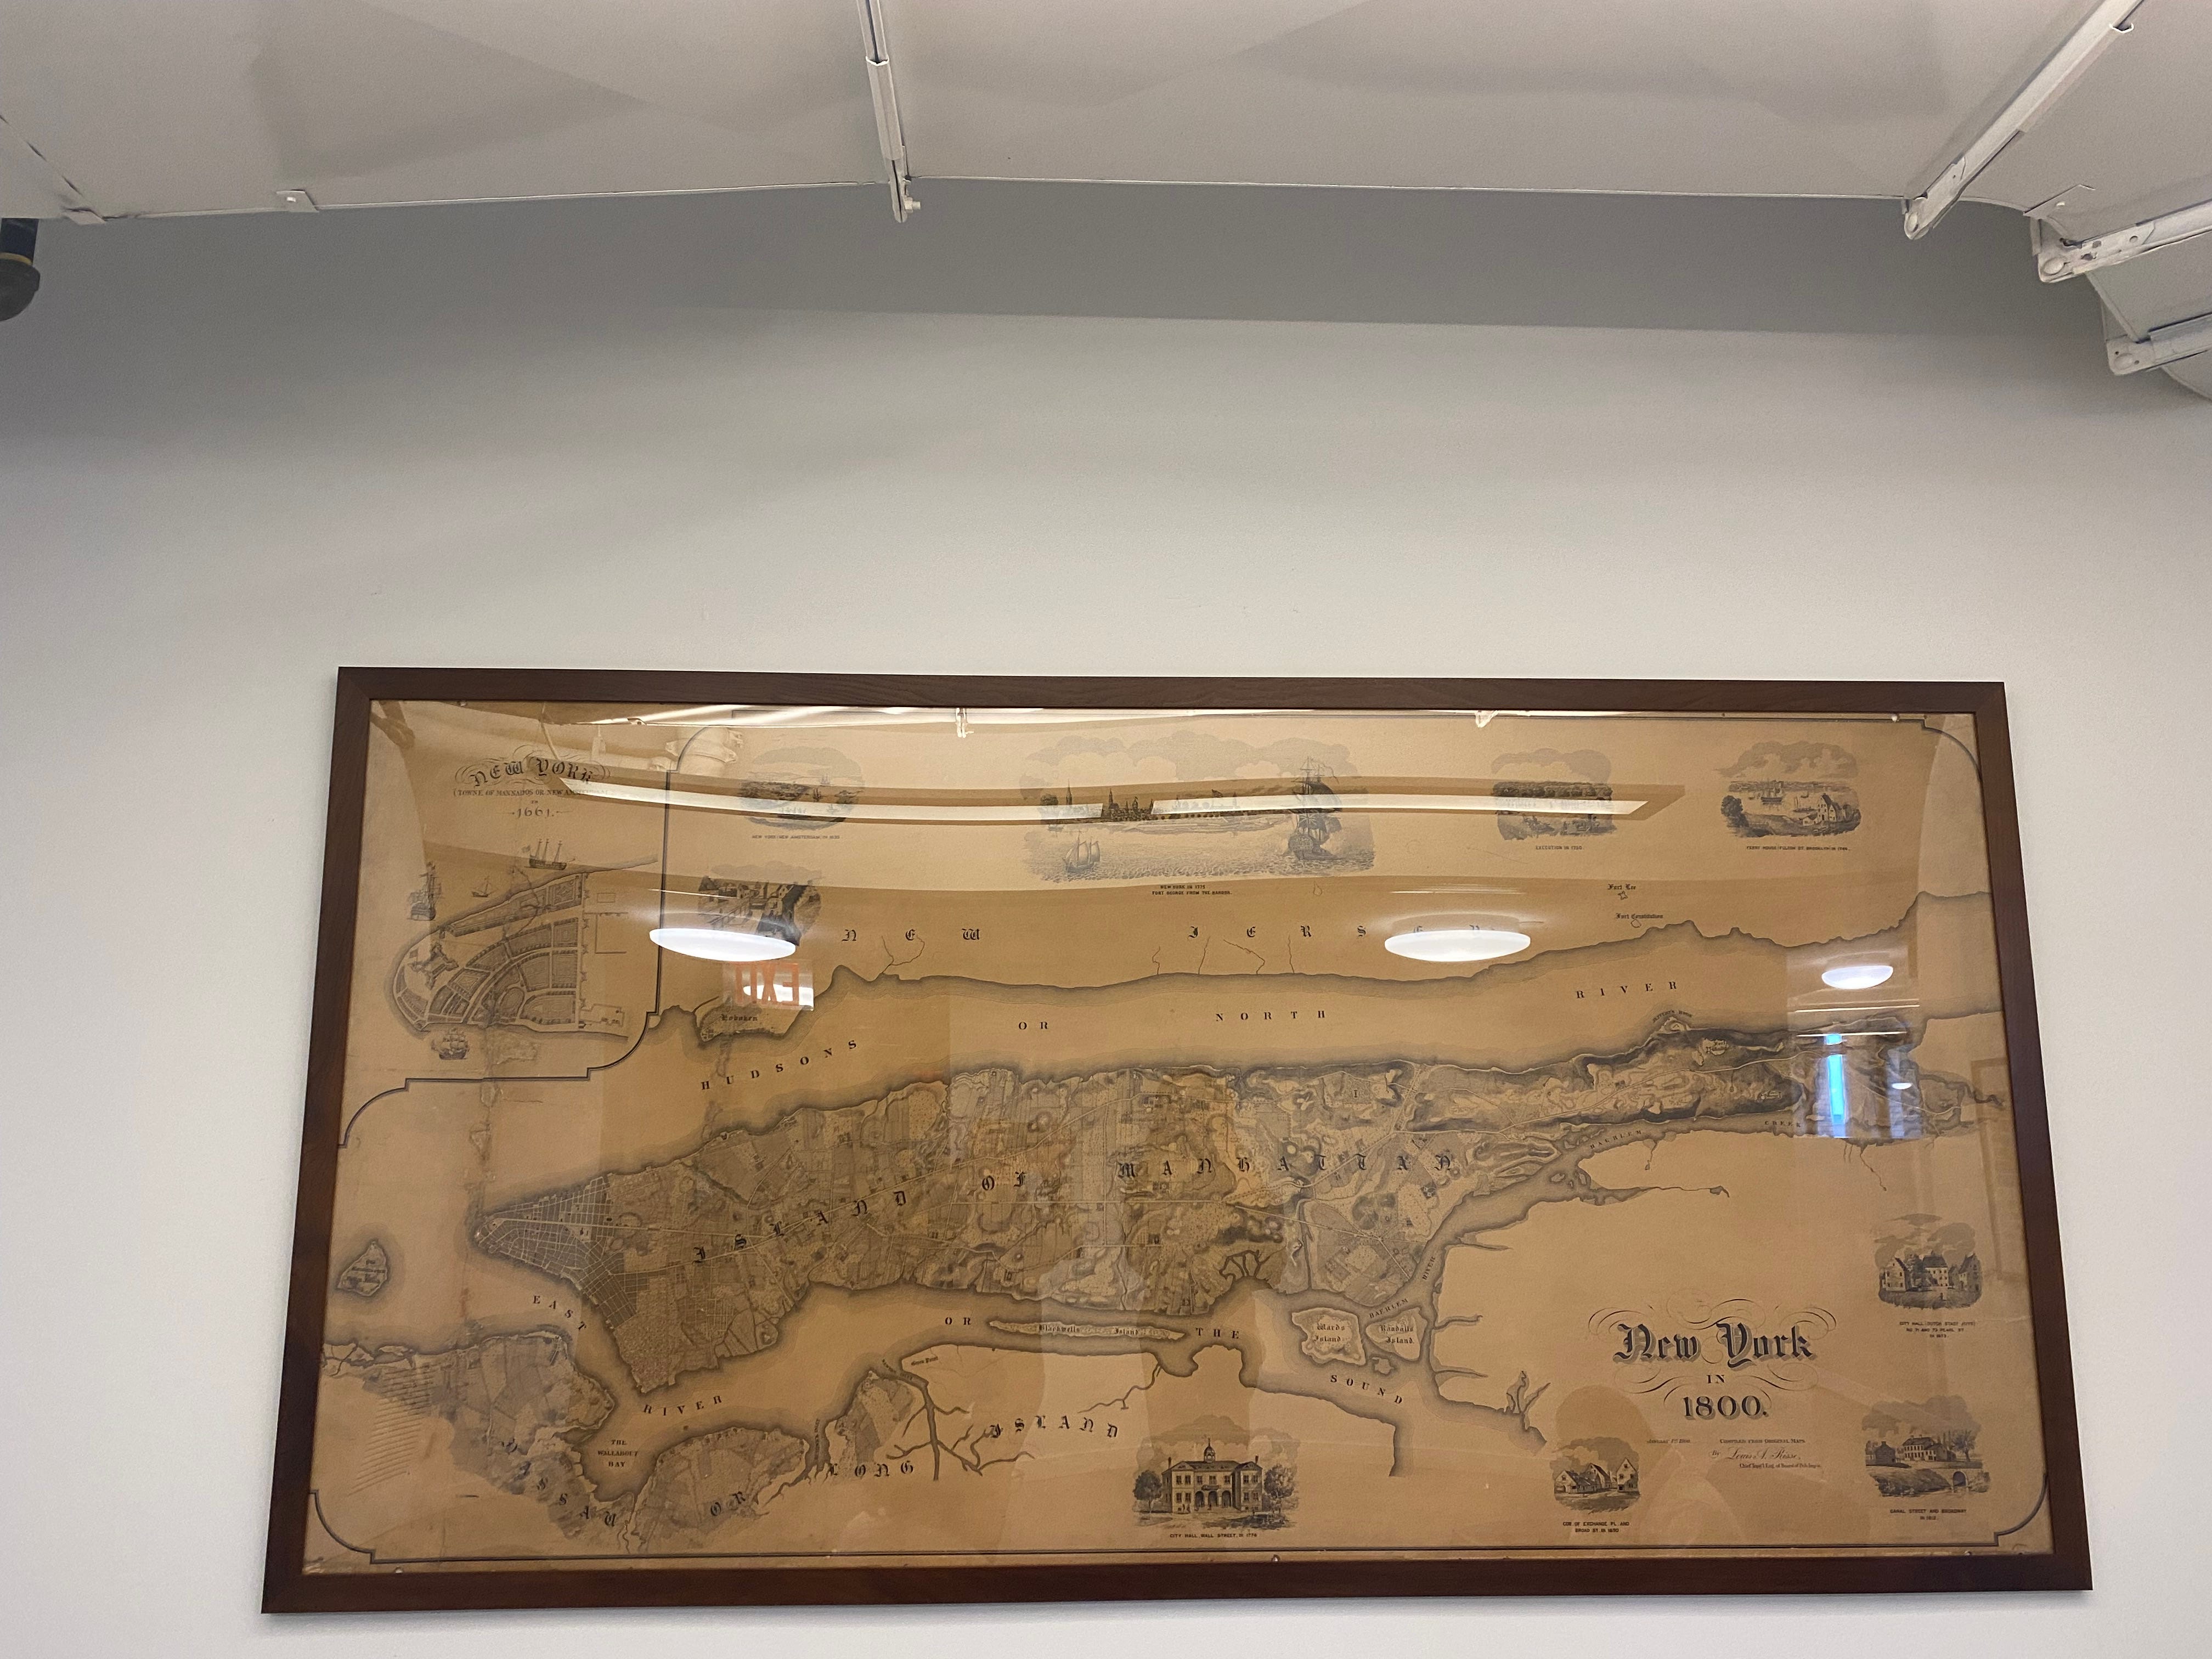
My favorite thing about the map is how different the Lower Manhattan grid is compared to the rest of the island. While most of the city has been planned in long rectangular blocks, Lower Manhattan looks irregular and more organic. This is because these streets were formed following the paths laid out by Native American trails, rather than on the Commissioners’ Plan of 1811 which defined most of the city’s streets grid. The Dutch settlers in the 17th century developed he area’s street pattern based on these existing trails and on the land’s topographical features. This is why this area today looks different from the classic gridiron that dominates the rest of the city.
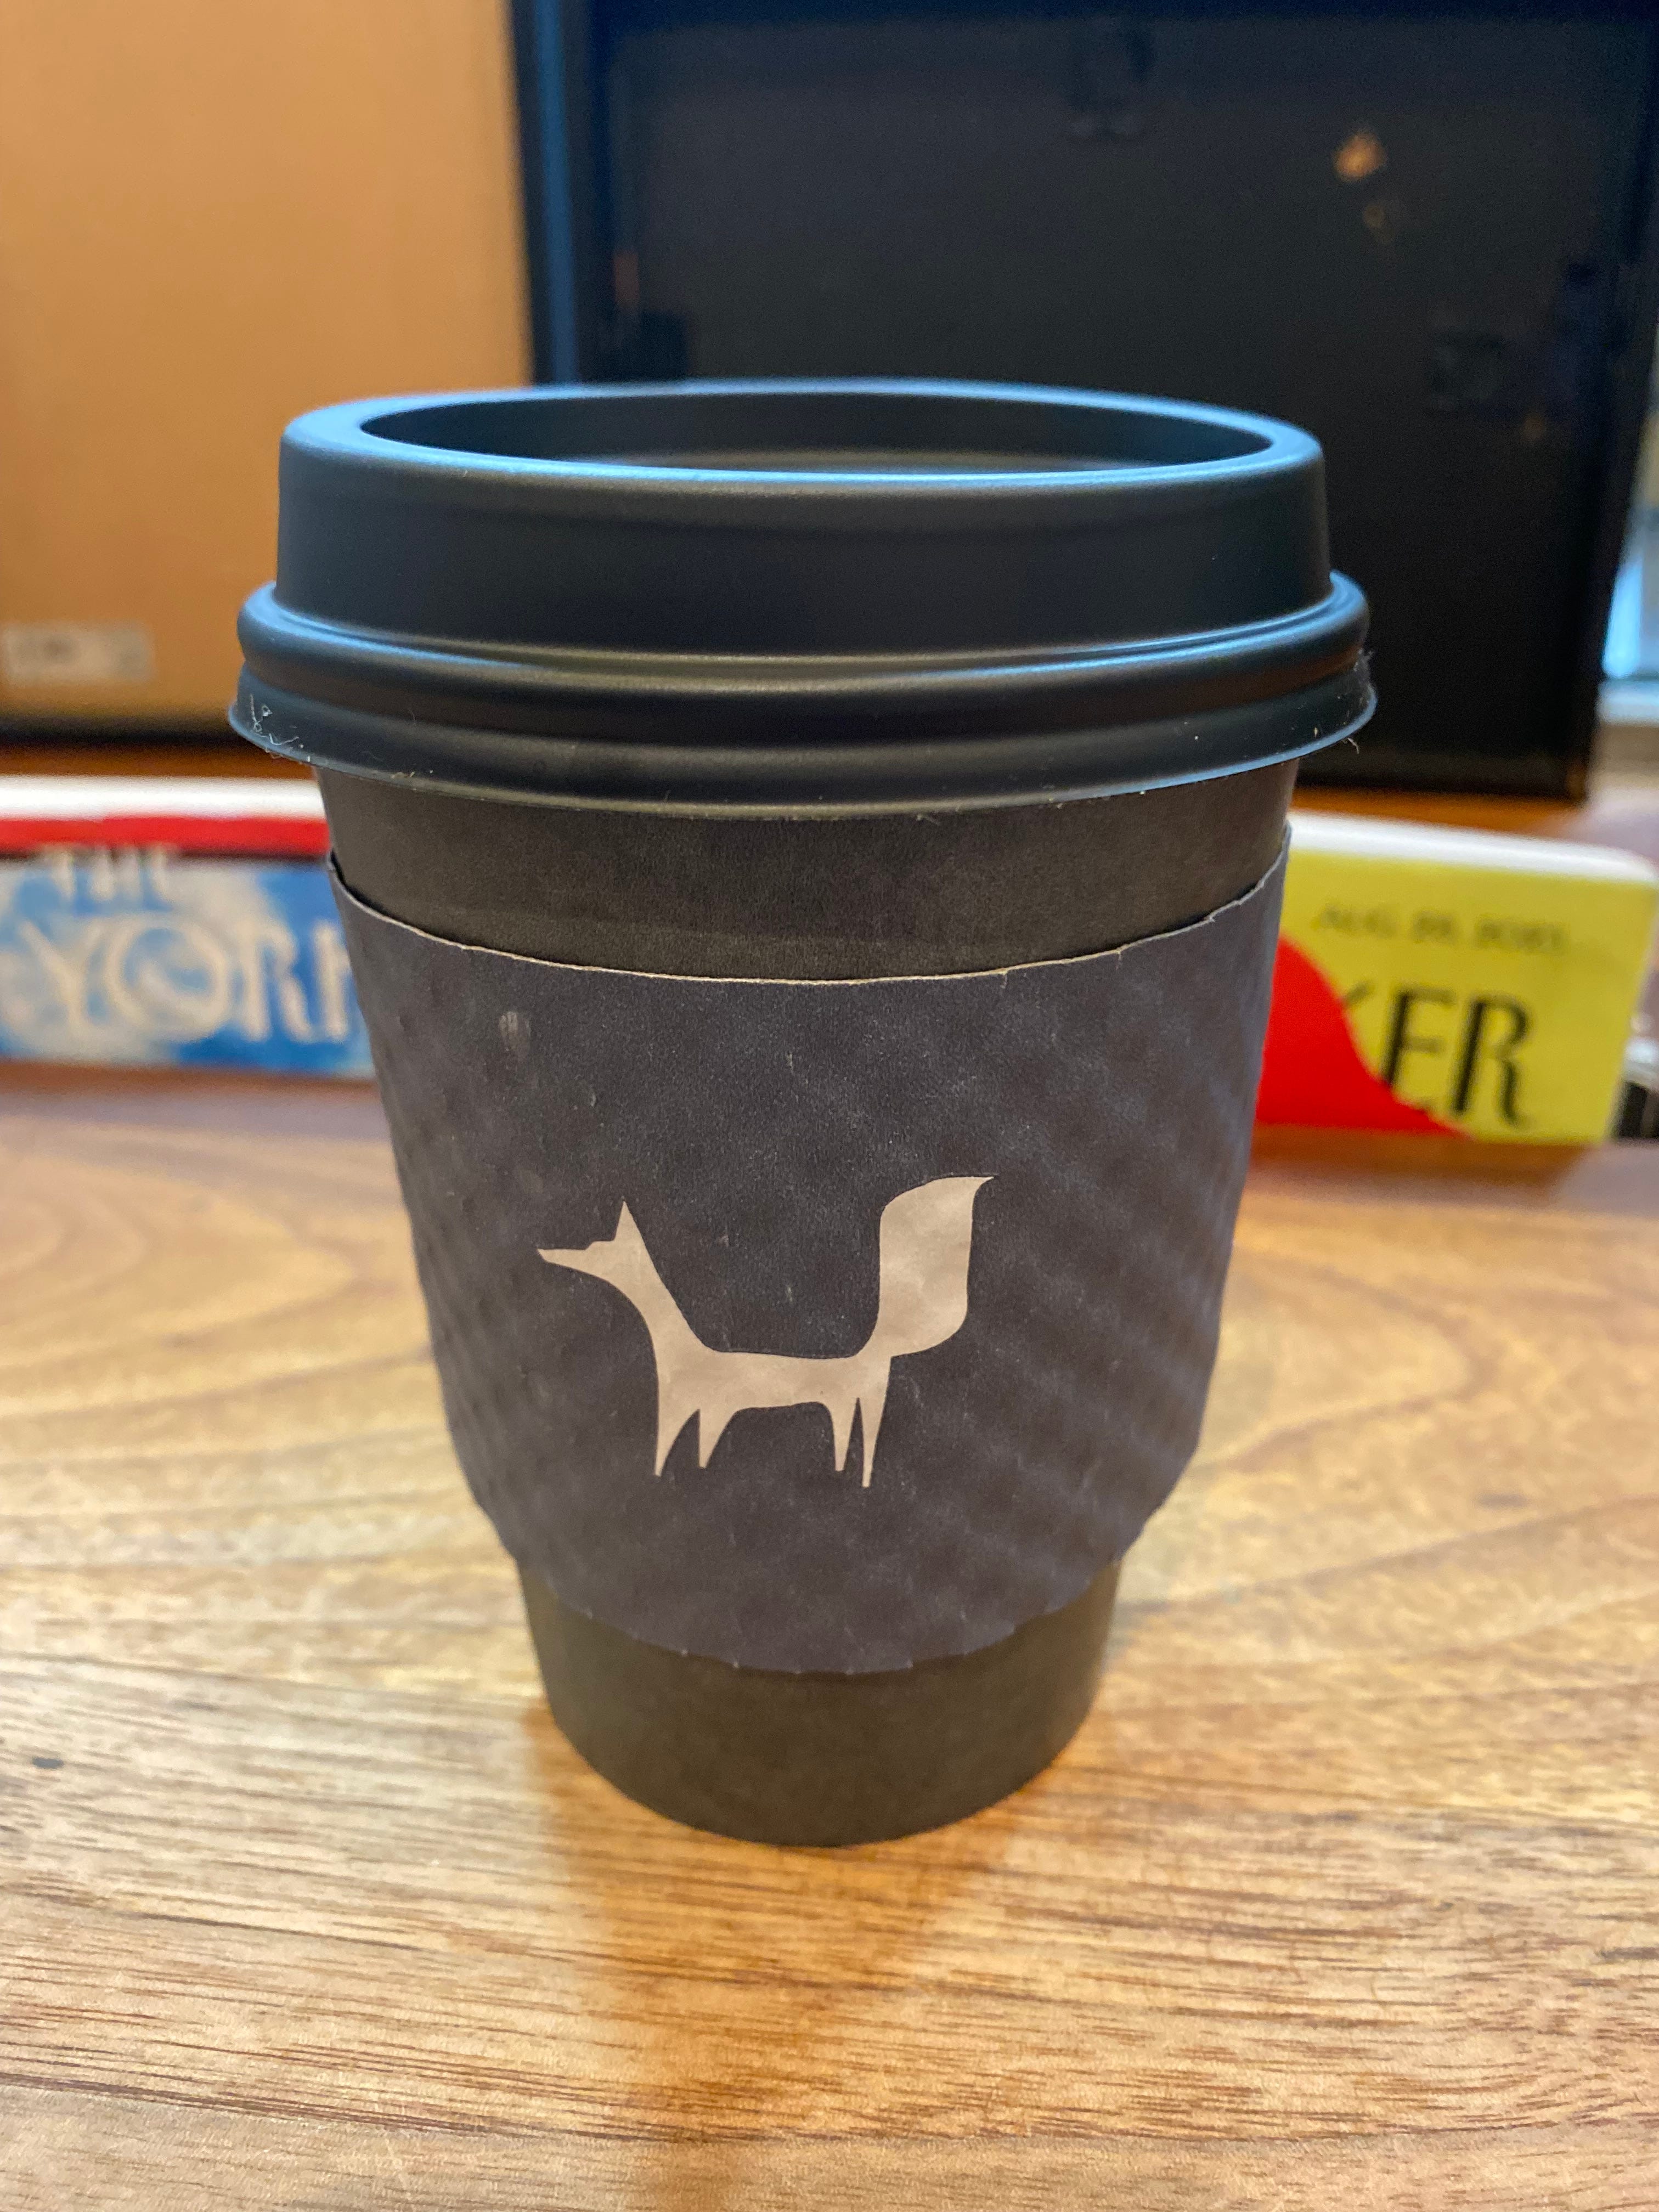
Also on this area, one of my two favorite coffee shops in the city, Black Fox. Great espresso in a small quaint shop in the middle of Wall Street’s bustle.
🌳 Museum #2: Urban Activism + “La Cabra”
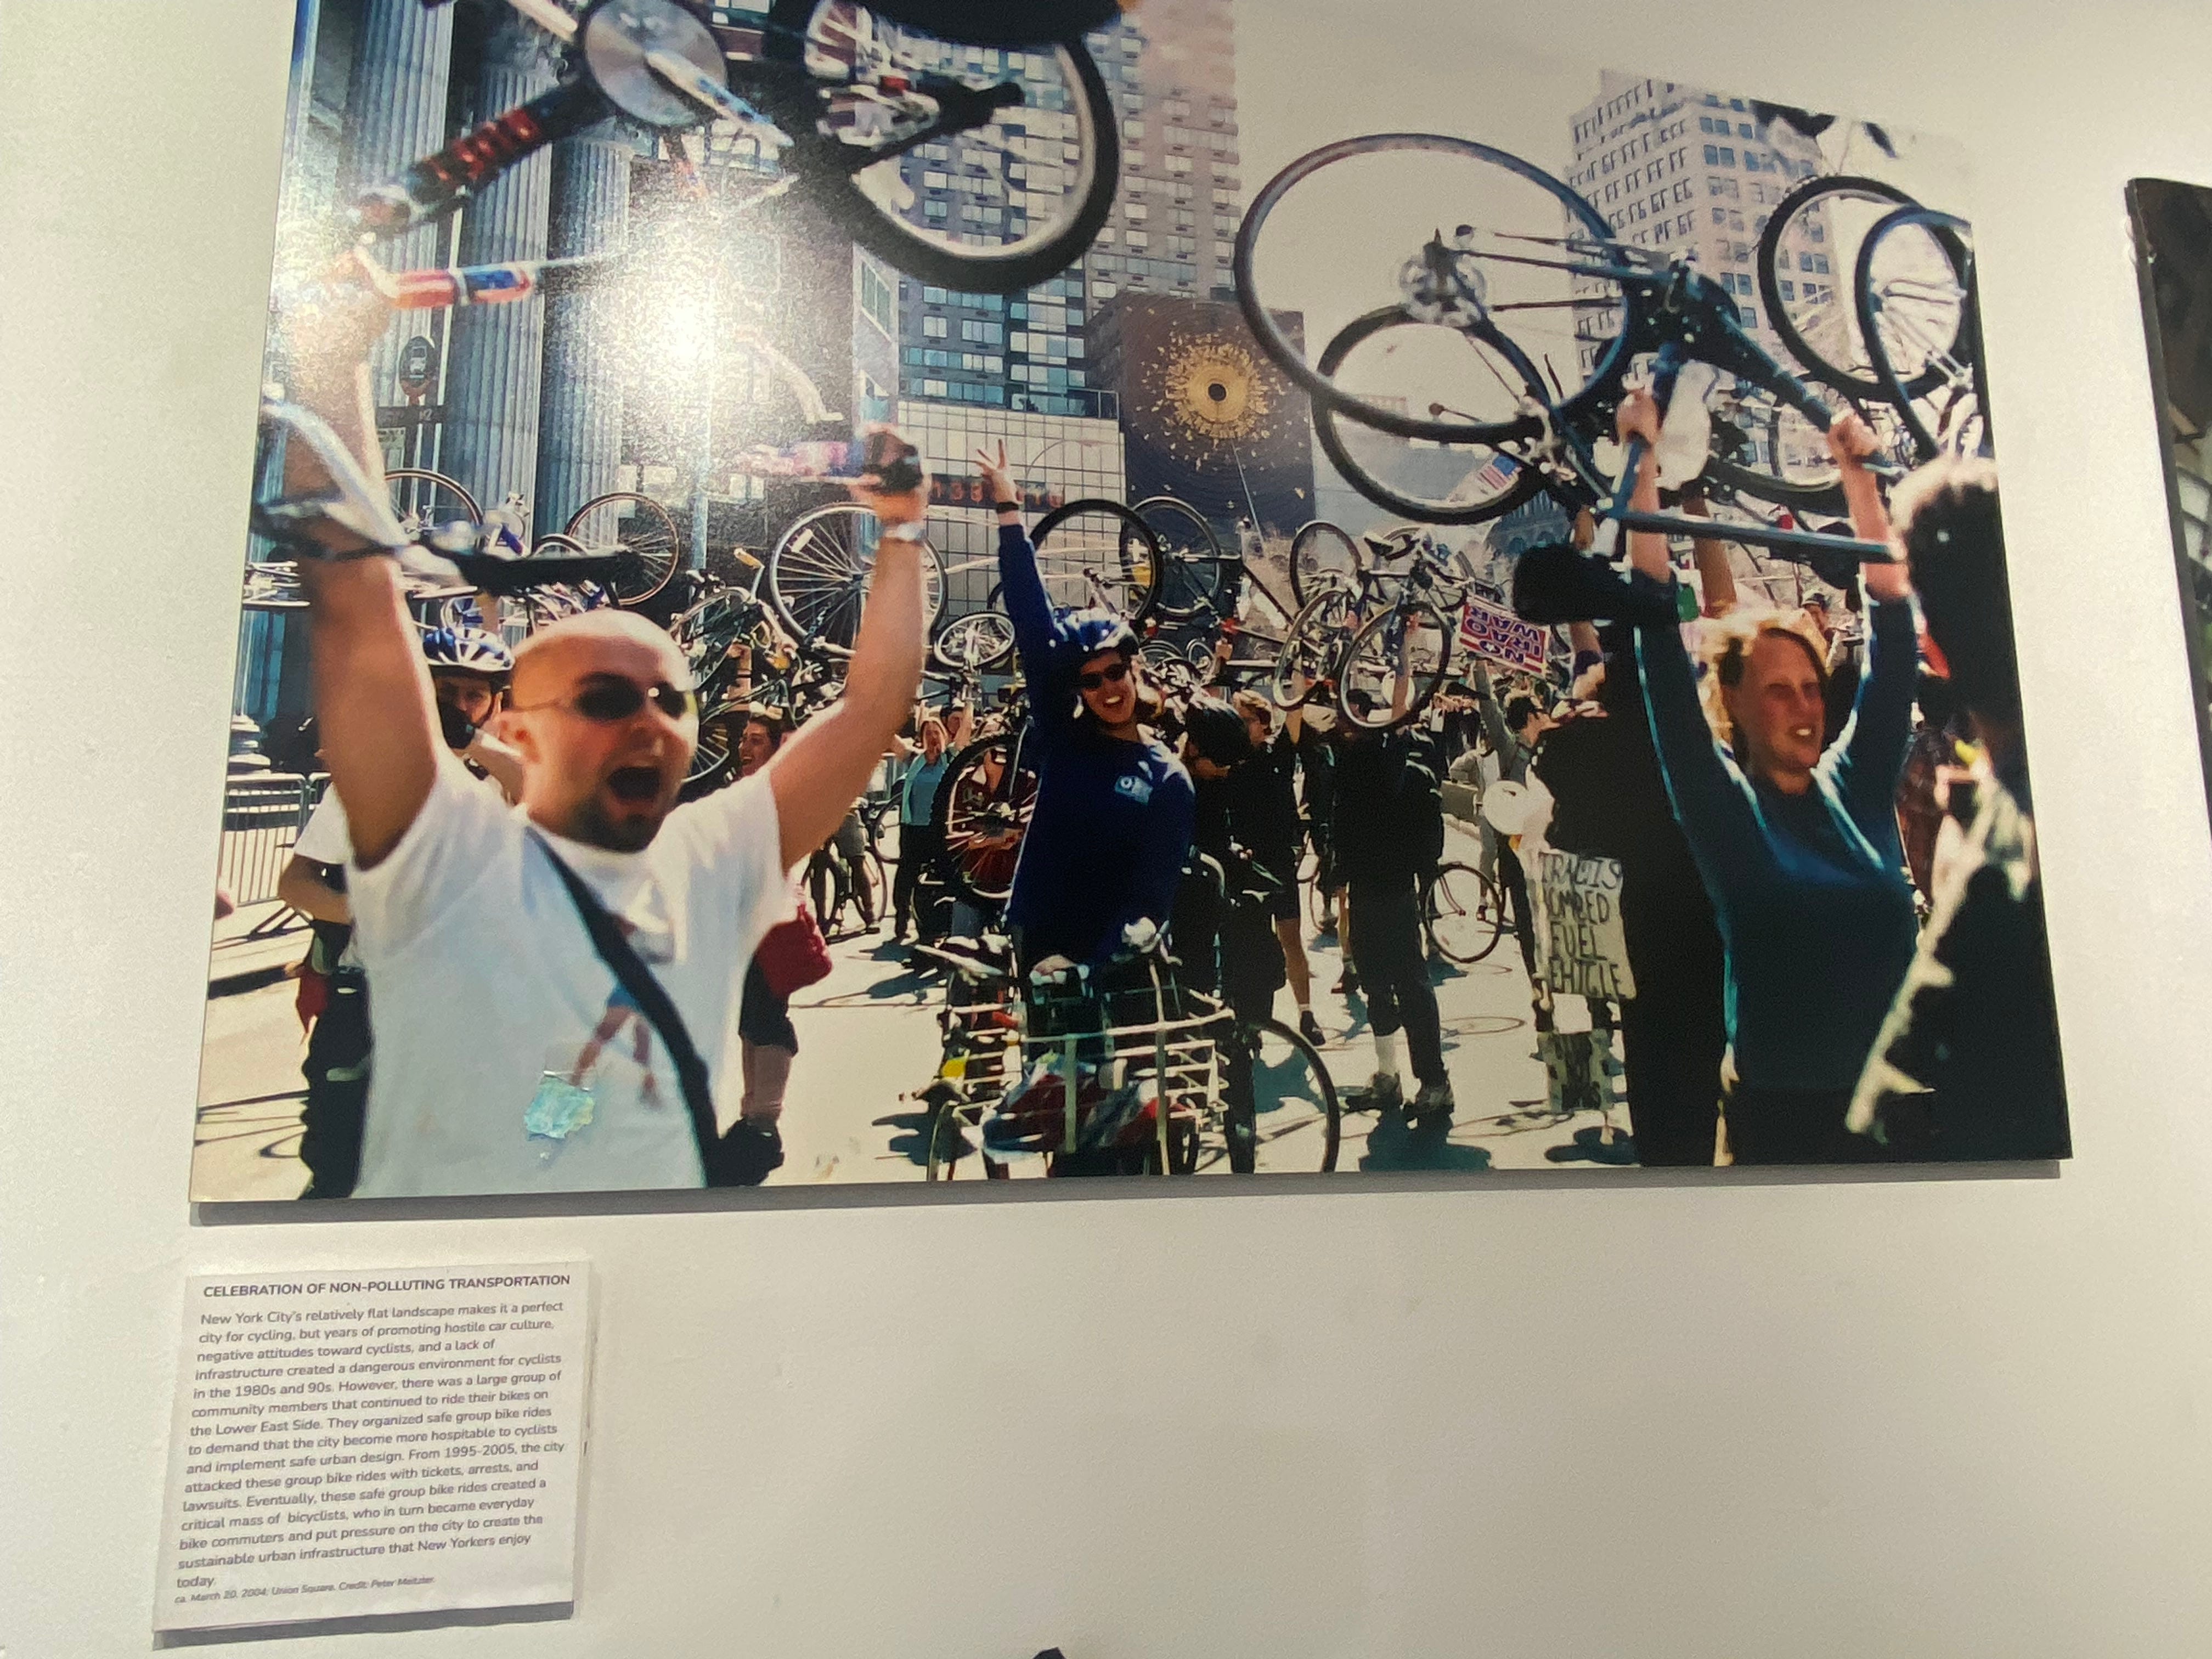
Onto the East Village, a lesser known museum called Museum of Reclaimed Urban Space (MoRUS). Sounded interesting, so I decided to check it out on a very hot Saturday afternoon. The museum showcases the history of urban community activism, focusing on the East Village. Its exhibits span many decades of protests on necessities like cycling infrastructure, land reclamation and squatting, and in general how environmental activism and community gatherings can come together. Some of my favorite photos included this 2004 bike protest:
And this map of community fridges maintained during the start of the COVID pandemic:
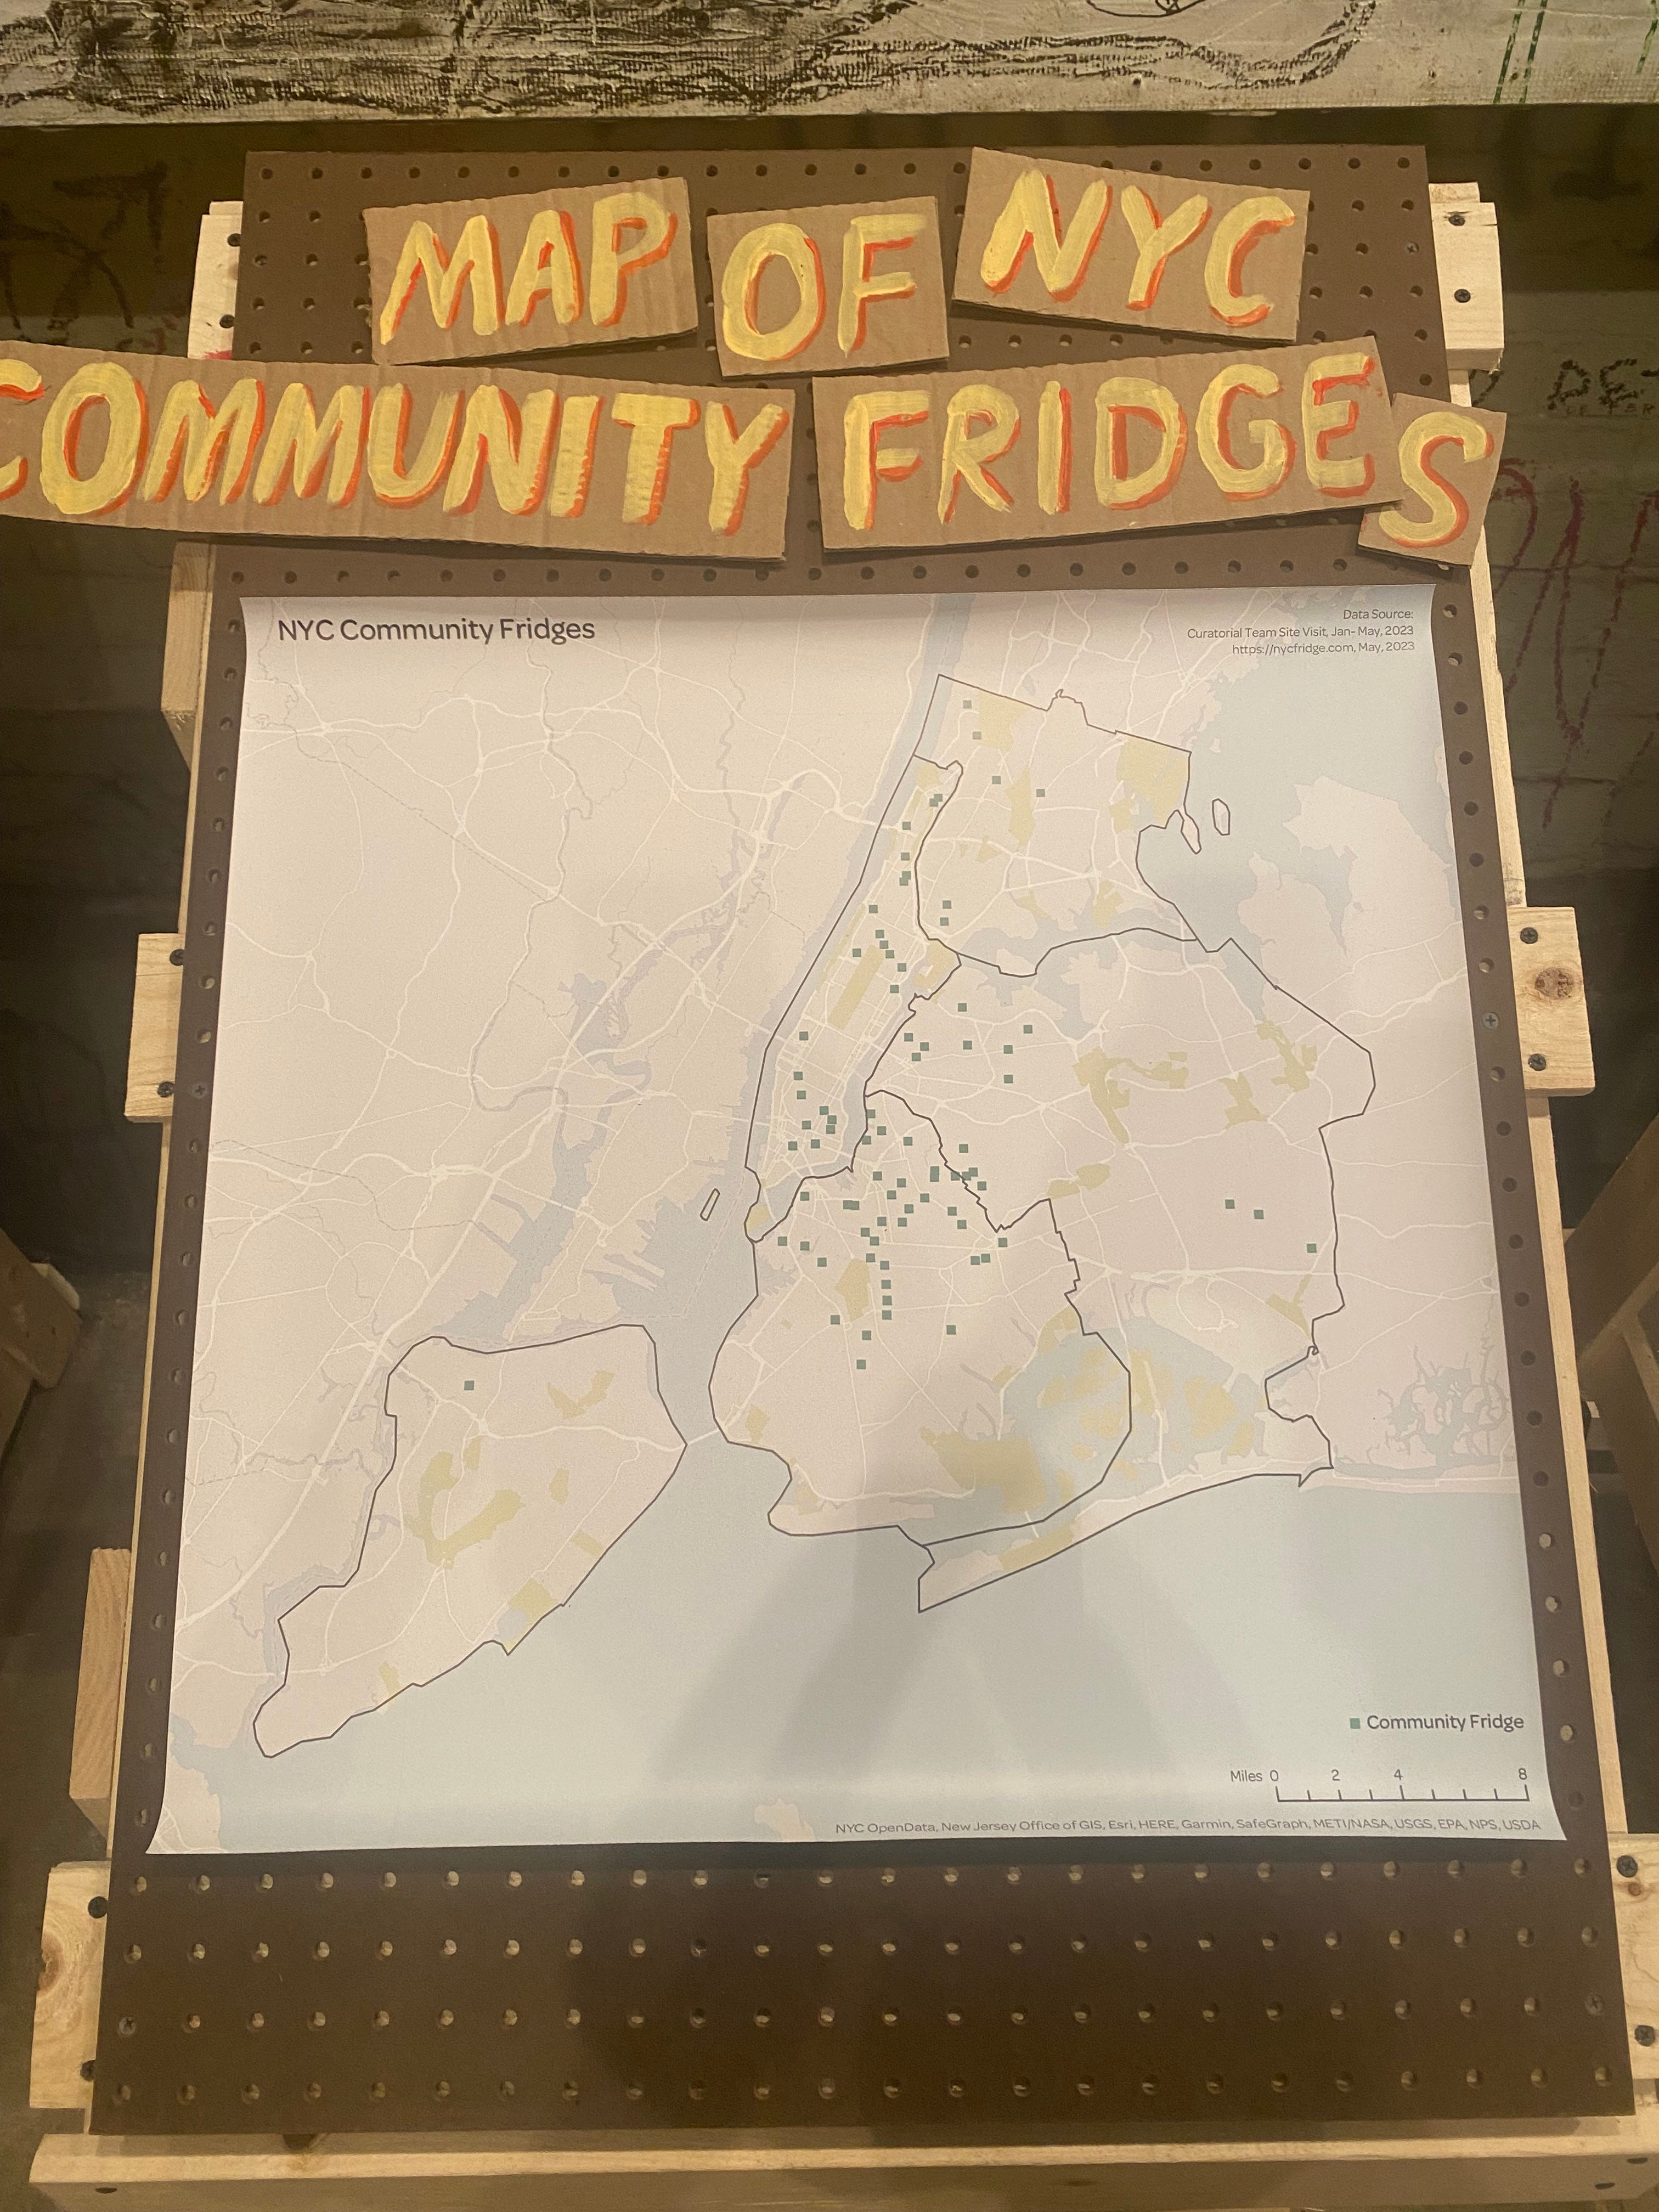
It was inspiring to see how these neighborhood movements had managed to achieve their goals. Often, the neighbors had to actively protest the politicians wanting to destroy community gardens or take out the bike infrastructure. They came up with creative ways of rallying together, including making a giant caterpillar of a couple of cyclists or even organizing group rides to push the City to reconsider its car-centric stance. These efforts to improve the neighborhood’s public spaces were successful: today the East Village has the highest concentration of community gardens out of every neighborhood in the United States.
Also in East Village, my other favorite coffee shop: La Cabra. La Cabra is an entire experience, from the thoughtful and open design of the space to their extensive coffee selections. Along the middle part of the shop, you can see the baristas preparing your drinks and chat with them in the process. This is a place to indulge your coffee curiosity and learn about the obscure world of tasting notes. I would highly recommend making an extra trip if you are in the area and coupling it with …. a cookie from Levain! Conveniently only a 3 minute walk from La Cabra, the huge chocolate chip cookies from this bakery will pair well with the sourness of the coffee. Truly a great sensory experience, and you’ll feel filled for a few hours afterwards. 😄
🚇 Museum #2: New York Transit Museum
My other favorite museum was the New York Transit Museum. Found in Brooklyn, its entrance looks like this:

The Transit Museum boasts a collection of real subway cars from different eras of the NYC Subway, starting in the 1900s and going up to 2010. Here is one of them:
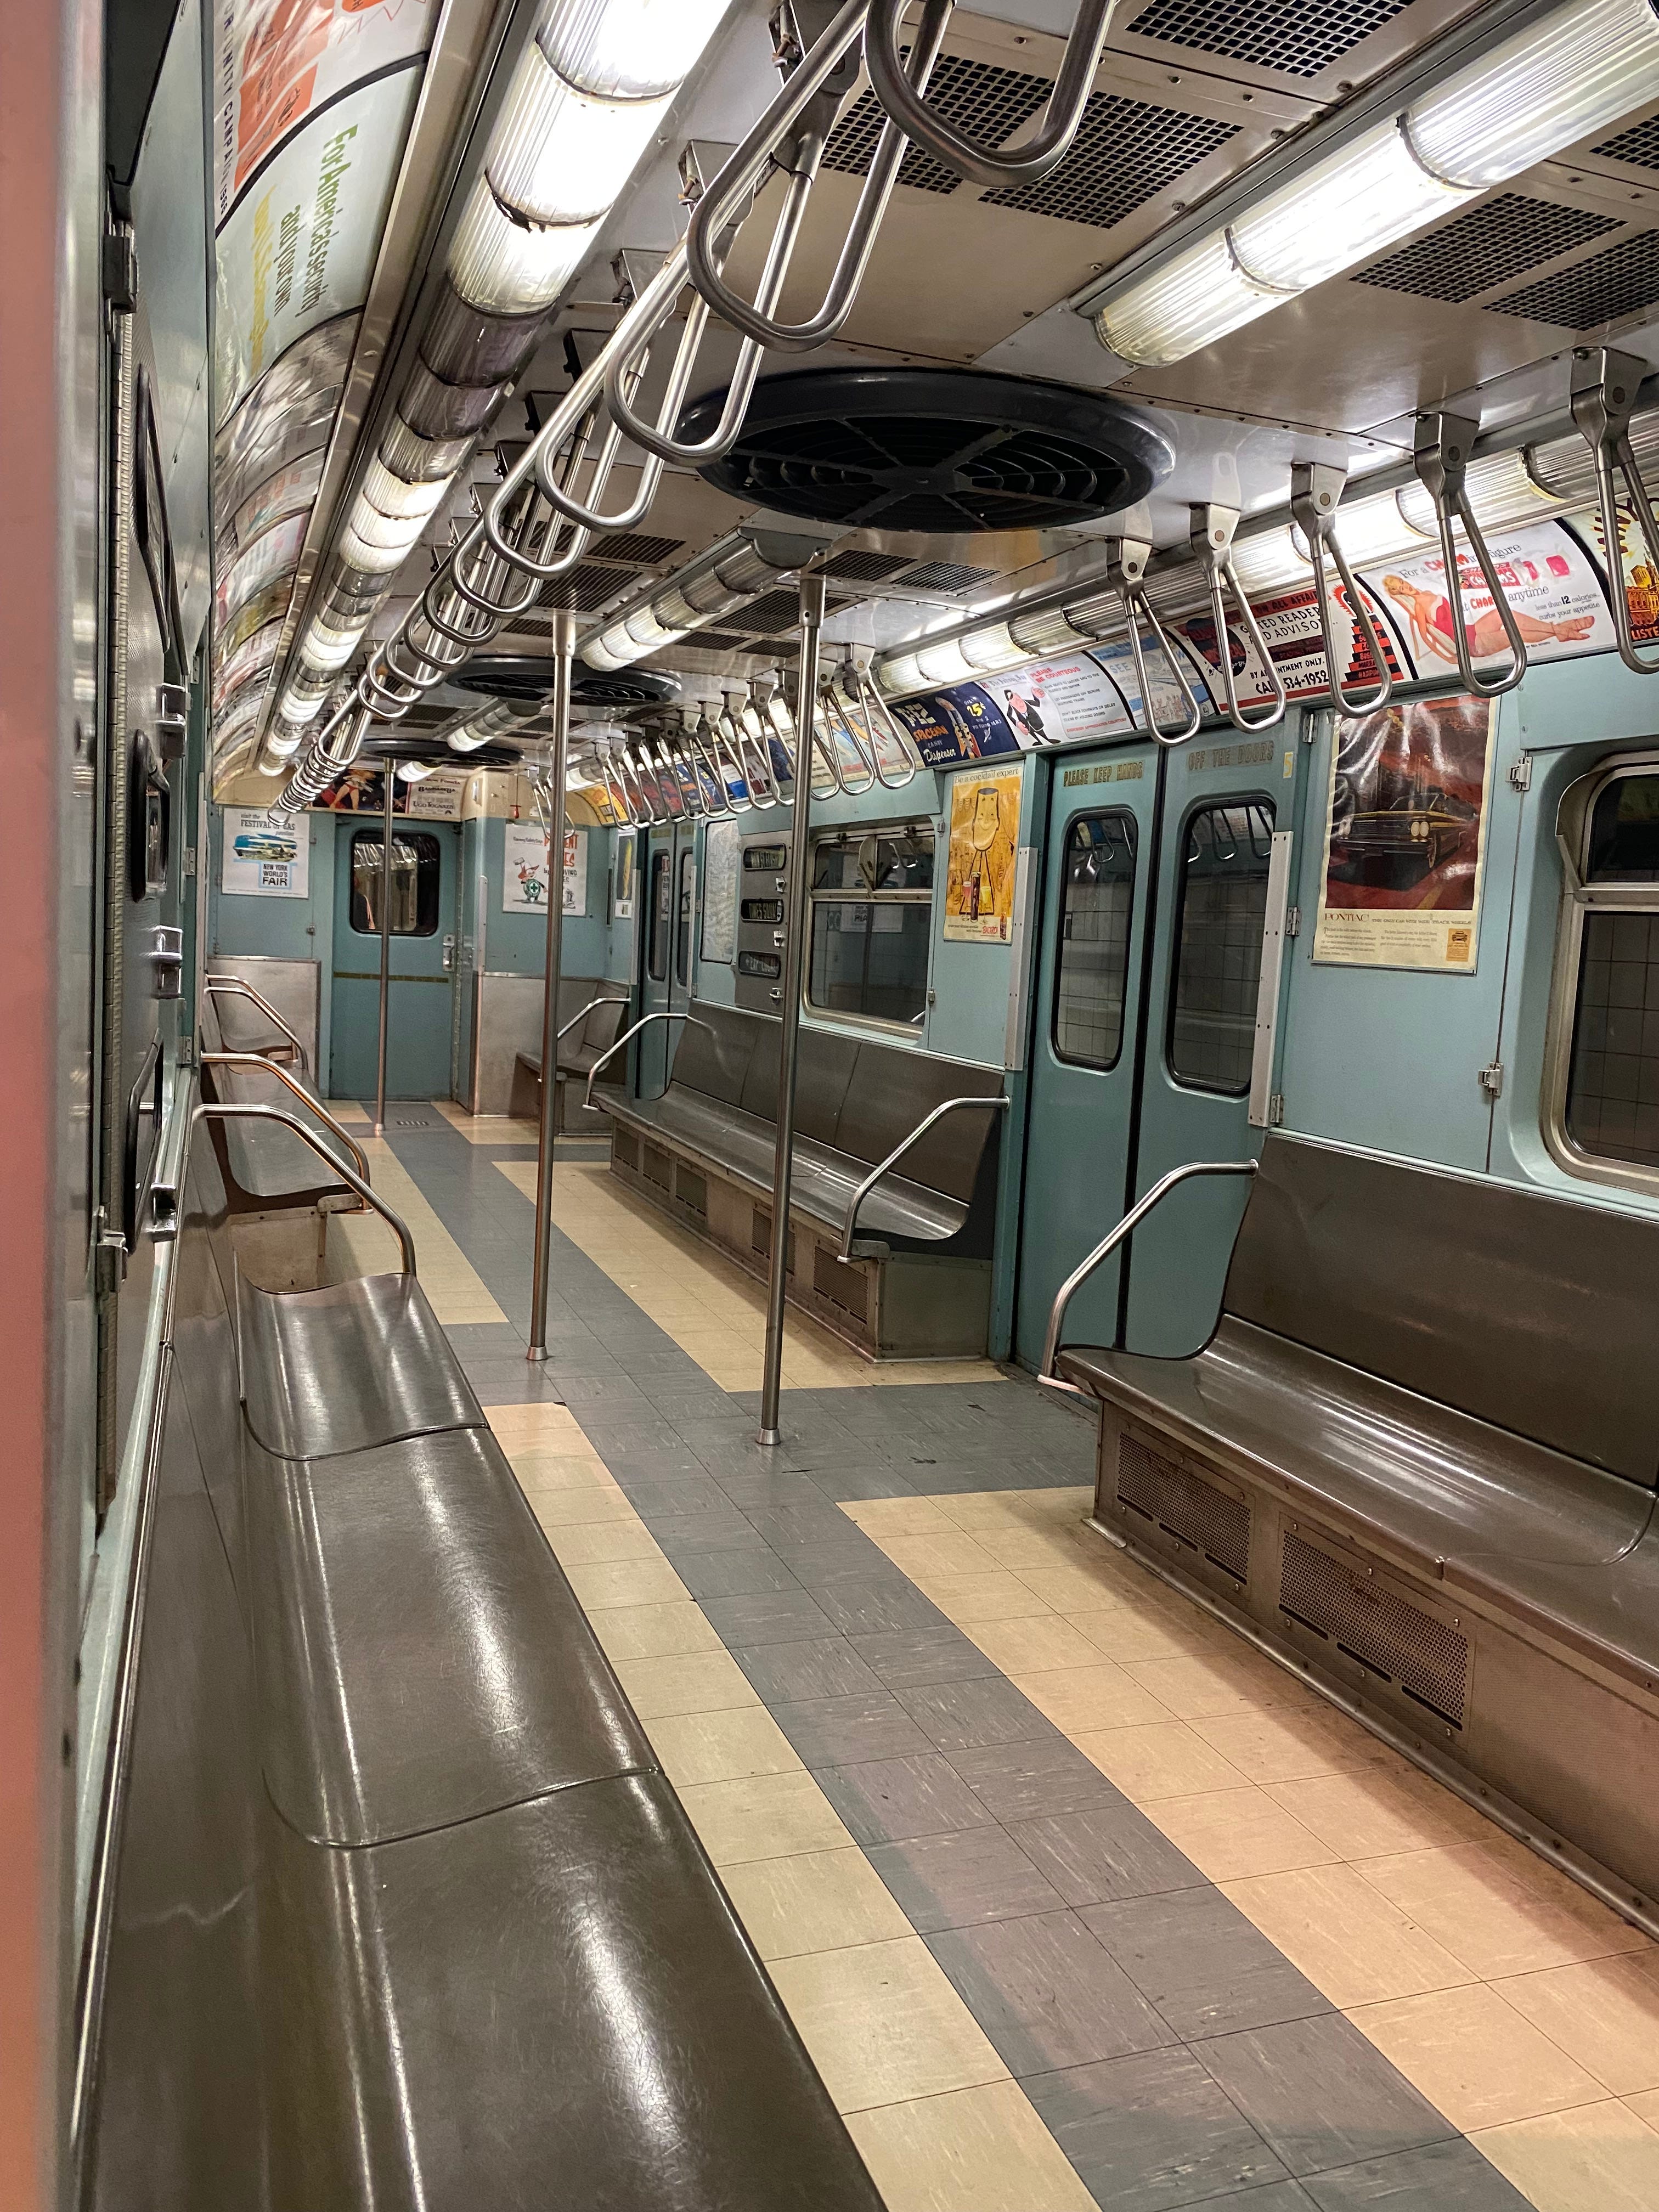
The NYC subway officially started operating in 1904 and quickly became the backbone of the City, supporting the rising population that enjoyed the freedom that comes with having efficient transportation options. To illustrate the effects this new system had on the City’s population, just check out the growth 3 of the 4 boroughs during 1910-1940: Brooklyn grew +921% (to around 340k people), Queens +507% (almost 200k) and the Bronx +566% (to 330k). Incredible!
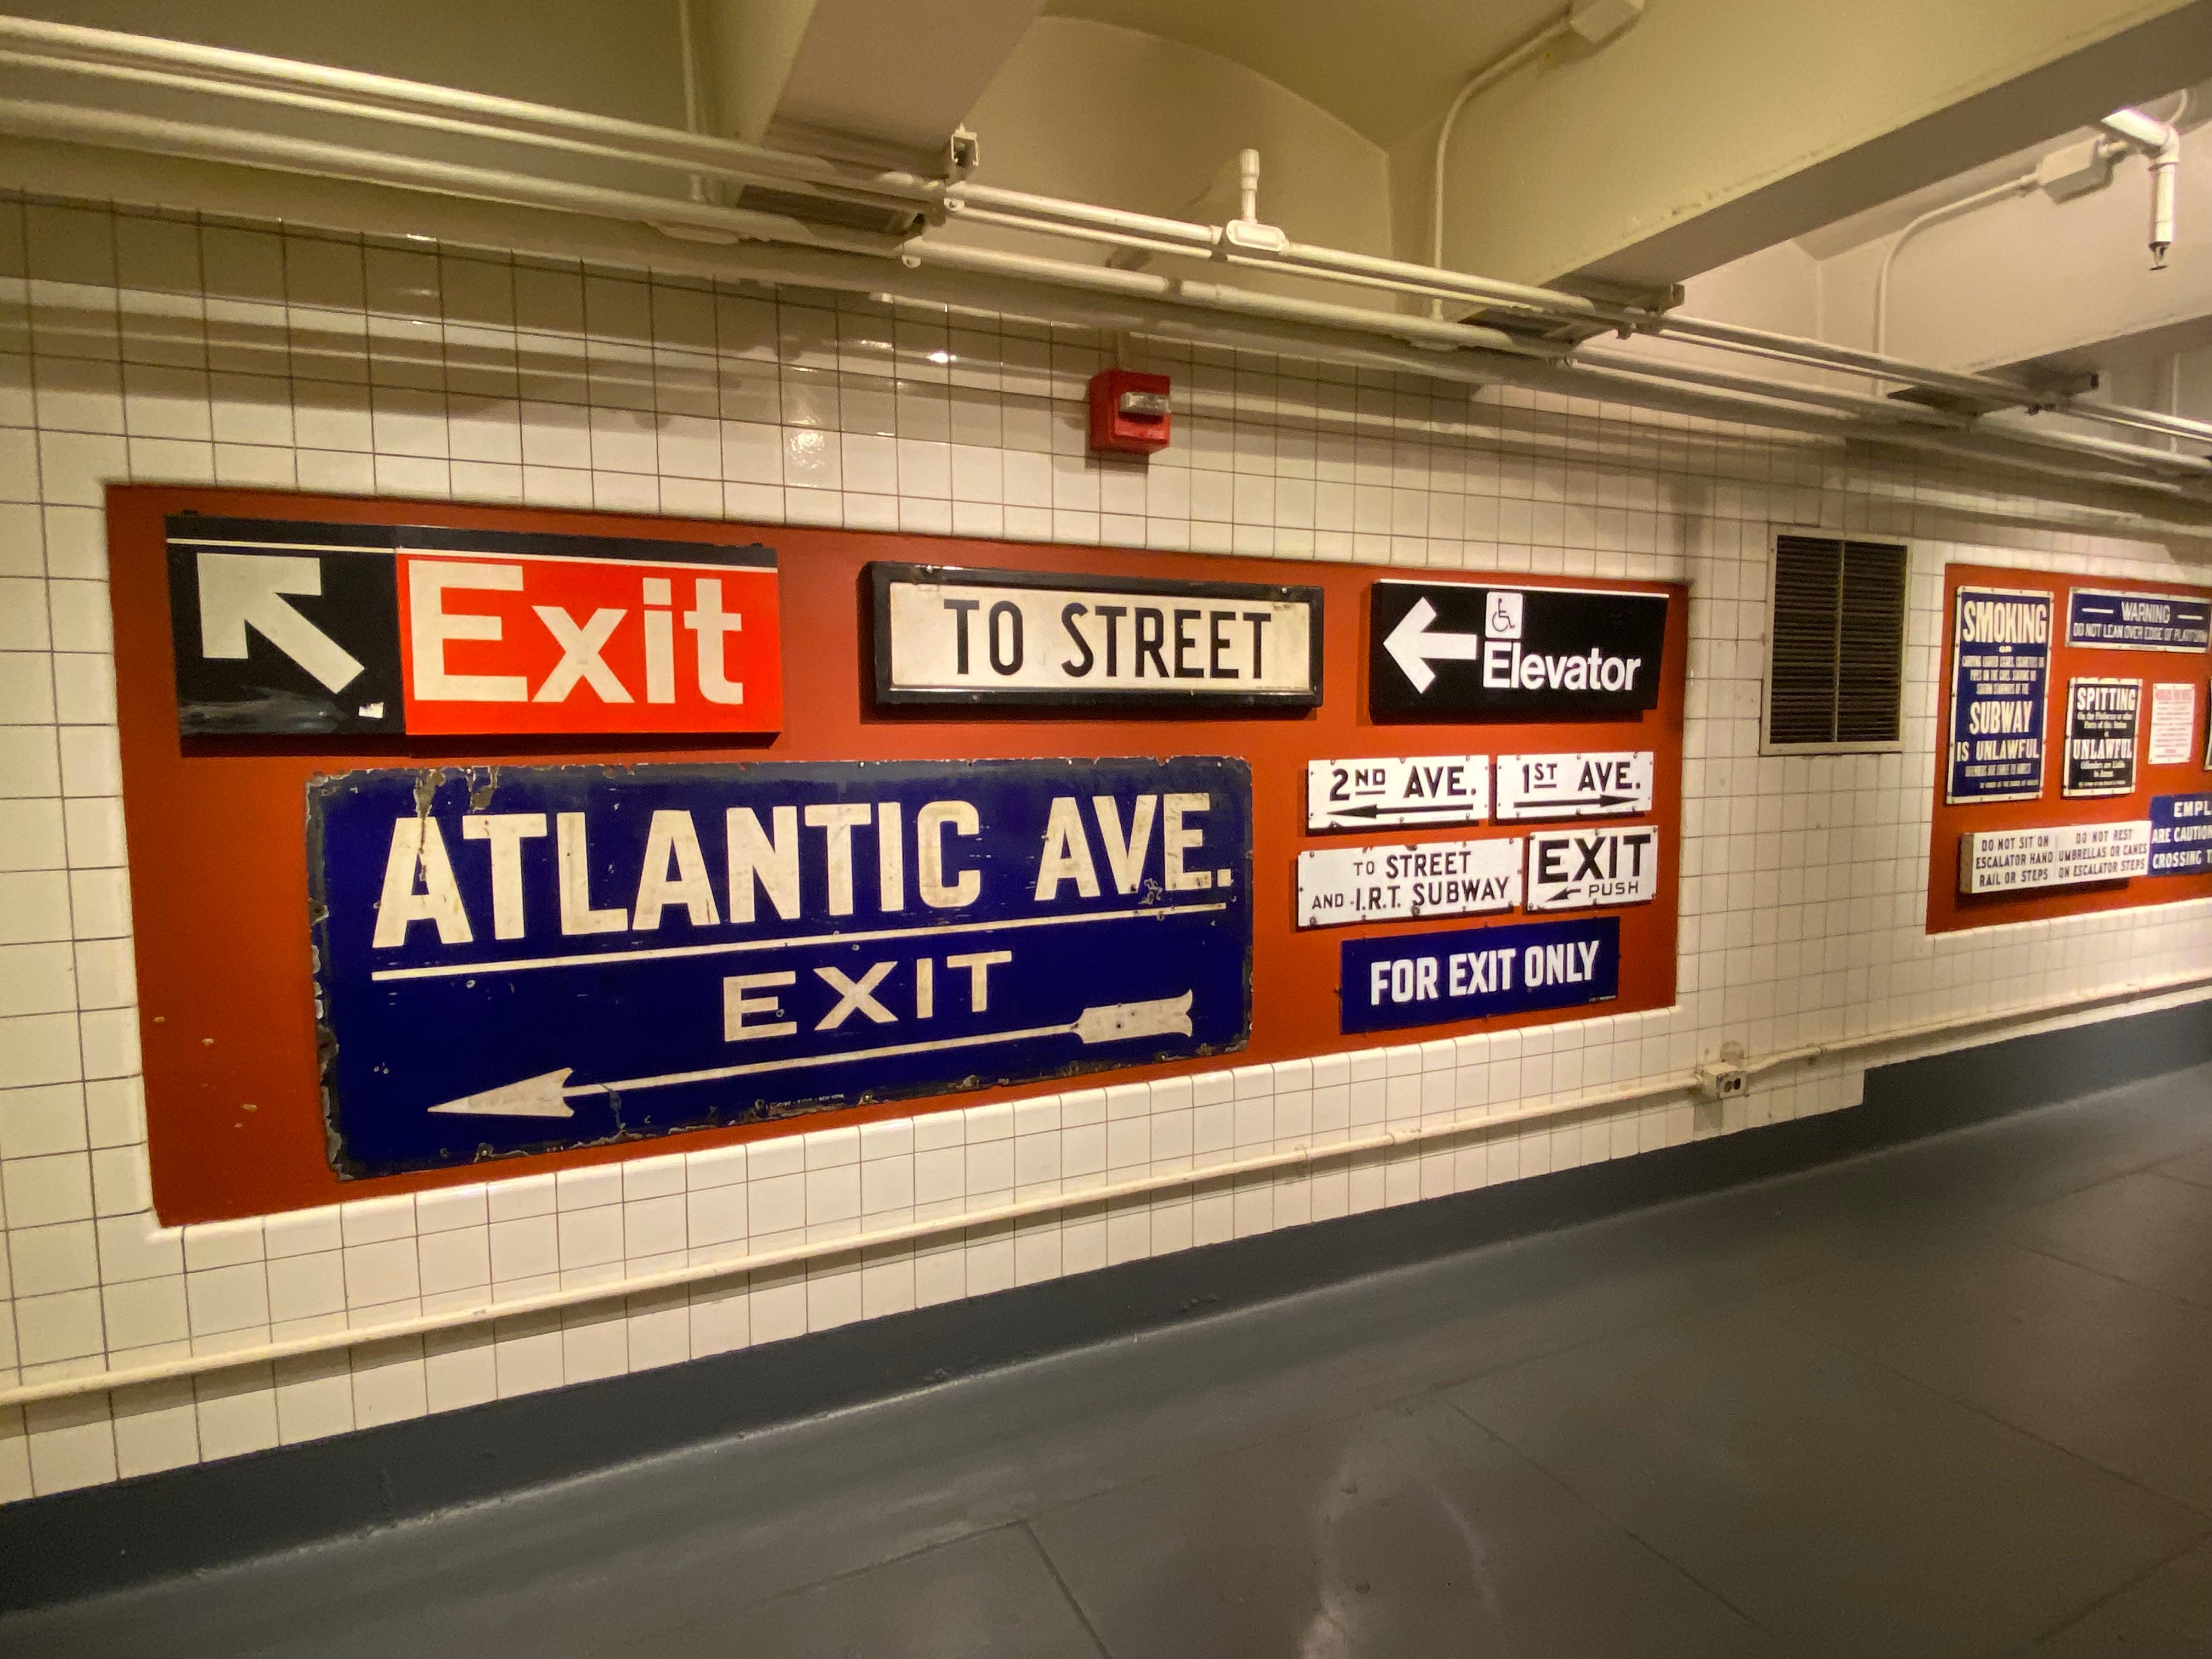
While touring the museum, I also learned about how different parts of the subway come together to deliver efficient transportation options to New Yorkers. One example: the sign designs. The system needs to direct people coming in and out of cars, entering or exiting the street level and everything in between. Importantly, it needs to do so clearly and efficiently. Information design is very important in these situations: how do you make clear signs showing a train’s direction, current station or even show users where the exit way is? Snapshot of some examples:
🌉 Final Thoughts
From going to a weekly vegan night fair to attending the US Open (finally checking going to 1 of the grand slams off of my bucket list 🎾), this summer was filled with explorations and discoveries. It’s been interesting taking in the city in all its complexity, from its datasets as a Data Engineer to its neighborhoods, coffee shops, book stores and museums. As an extra example of this complexity and scale, here is a picture I took of the Panorama of the City of New York (originally shown at the World’s Fair in 1964, now on display at the Queens Museum). This 3-D urban project is color-coded: e.g. red represents public housing, green is parks etc. Its streets are a scaled-down version of the real life New York, every inch of the Panorama represents 100 feet of the city and it spans every borough:
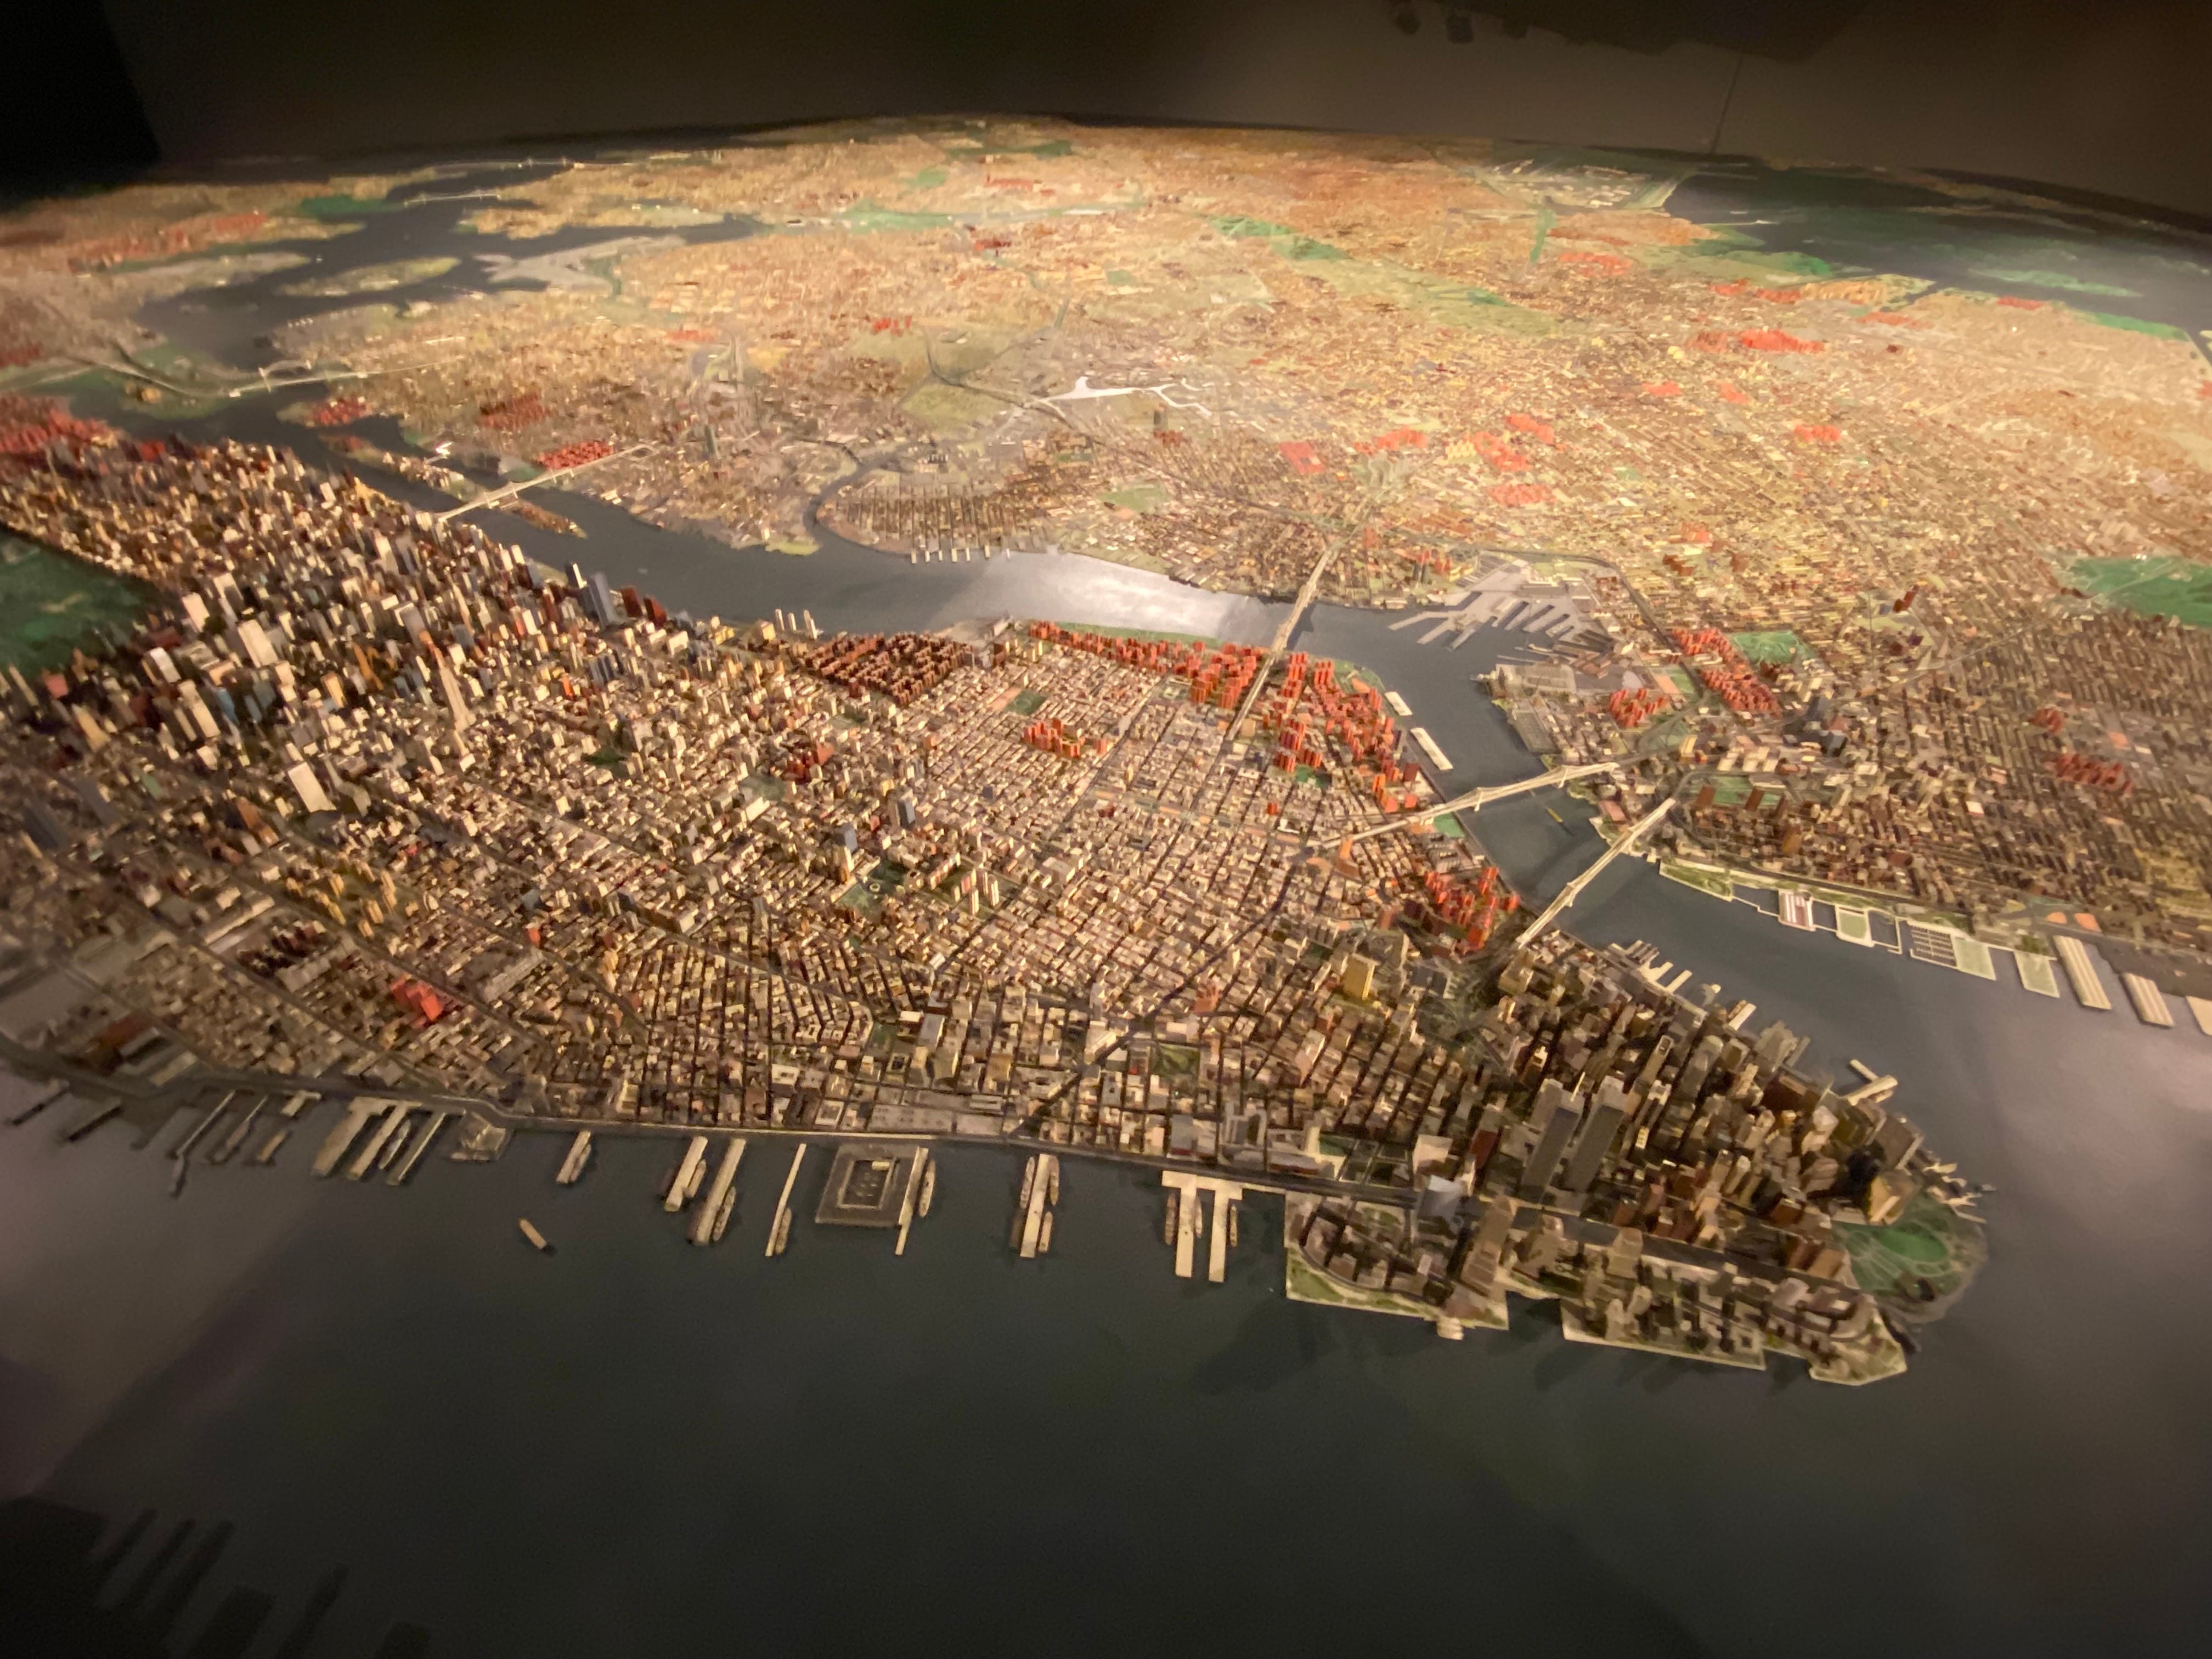
Pretty cool and a little mind bending!
I’ll leave you with this last tidbit, hope you enjoyed and thanks for reading!