

Telling Time With Maps (Issue #6)
Isochrones, Subway Sheds and TravelTime

| Fun updates:
I recently wrote up a Medium article on the global open data landscape, check it out!
Hi all! 👋
What if maps could tell the time? Distances between places can be nice, but most times we want to know how long a trip will be, rather than how far it is. Whatever method you use to measure the time when traveling: 3 songs, one book chapter or half a podcast episode, having a good sense of how long a journey should take is a very important part of personal mobility. It turns out these maps, also called isochrone maps, have been around for quite a bit in exactly these transportation-related scenarios. Hence, in this issue I wanted to talk more about how a map can represent passing time and some cool applications for critical work. Let’s get started!
🚶♀️ Isochrones: how far can you get by walking x minutes?
Here is what an isochrone typically looks like:
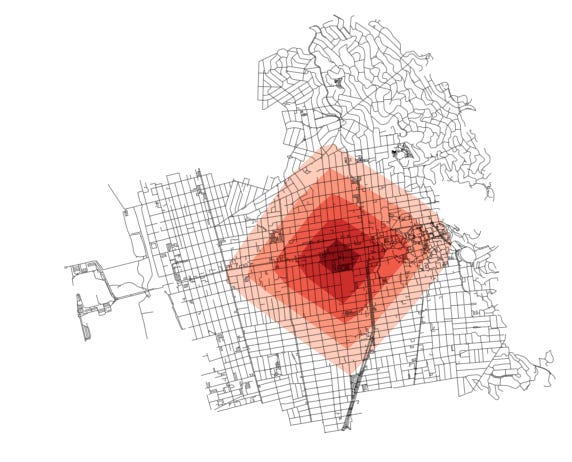
This is a map of Berkeley showing how far you can get by walking 5, 10 and 15 minutes from a single point in Downtown. (side note: the map was made with a really cool Python package called OSMnx, created by Berkeley alum and USC professor Geoff Boeing). Maps like these are used to make decisions on how accessible communities are and where to invest. For example, are amenities in a neighborhood reachable in a short walk or in a bus ride?
Within the same urban area, neighborhoods typically vary in walkability: lower income neighborhoods are often more walkable than higher income ones. This is often because people with lower incomes tend to live in denser areas and rely more on public transit rather than on owning a car. While this result makes sense, it is also probably unexpected. Part of the reason is that walkability indices measure street distances, block lengths or network density, but they don’t capture subtler aspects that affect mobility such as having good sidewalks and lighting. Since these insights inform new infrastructure plans, an improved index would capture not only these travel times but also the quality of the street elements.
🚋 Subway Sheds
However, isochrones don’t stop at just walking distances. Over time, and with the advent of new open data projects, people have been able to build useful apps for their own public transit needs too. One example of doing so is the NYC Subway Sheds project:
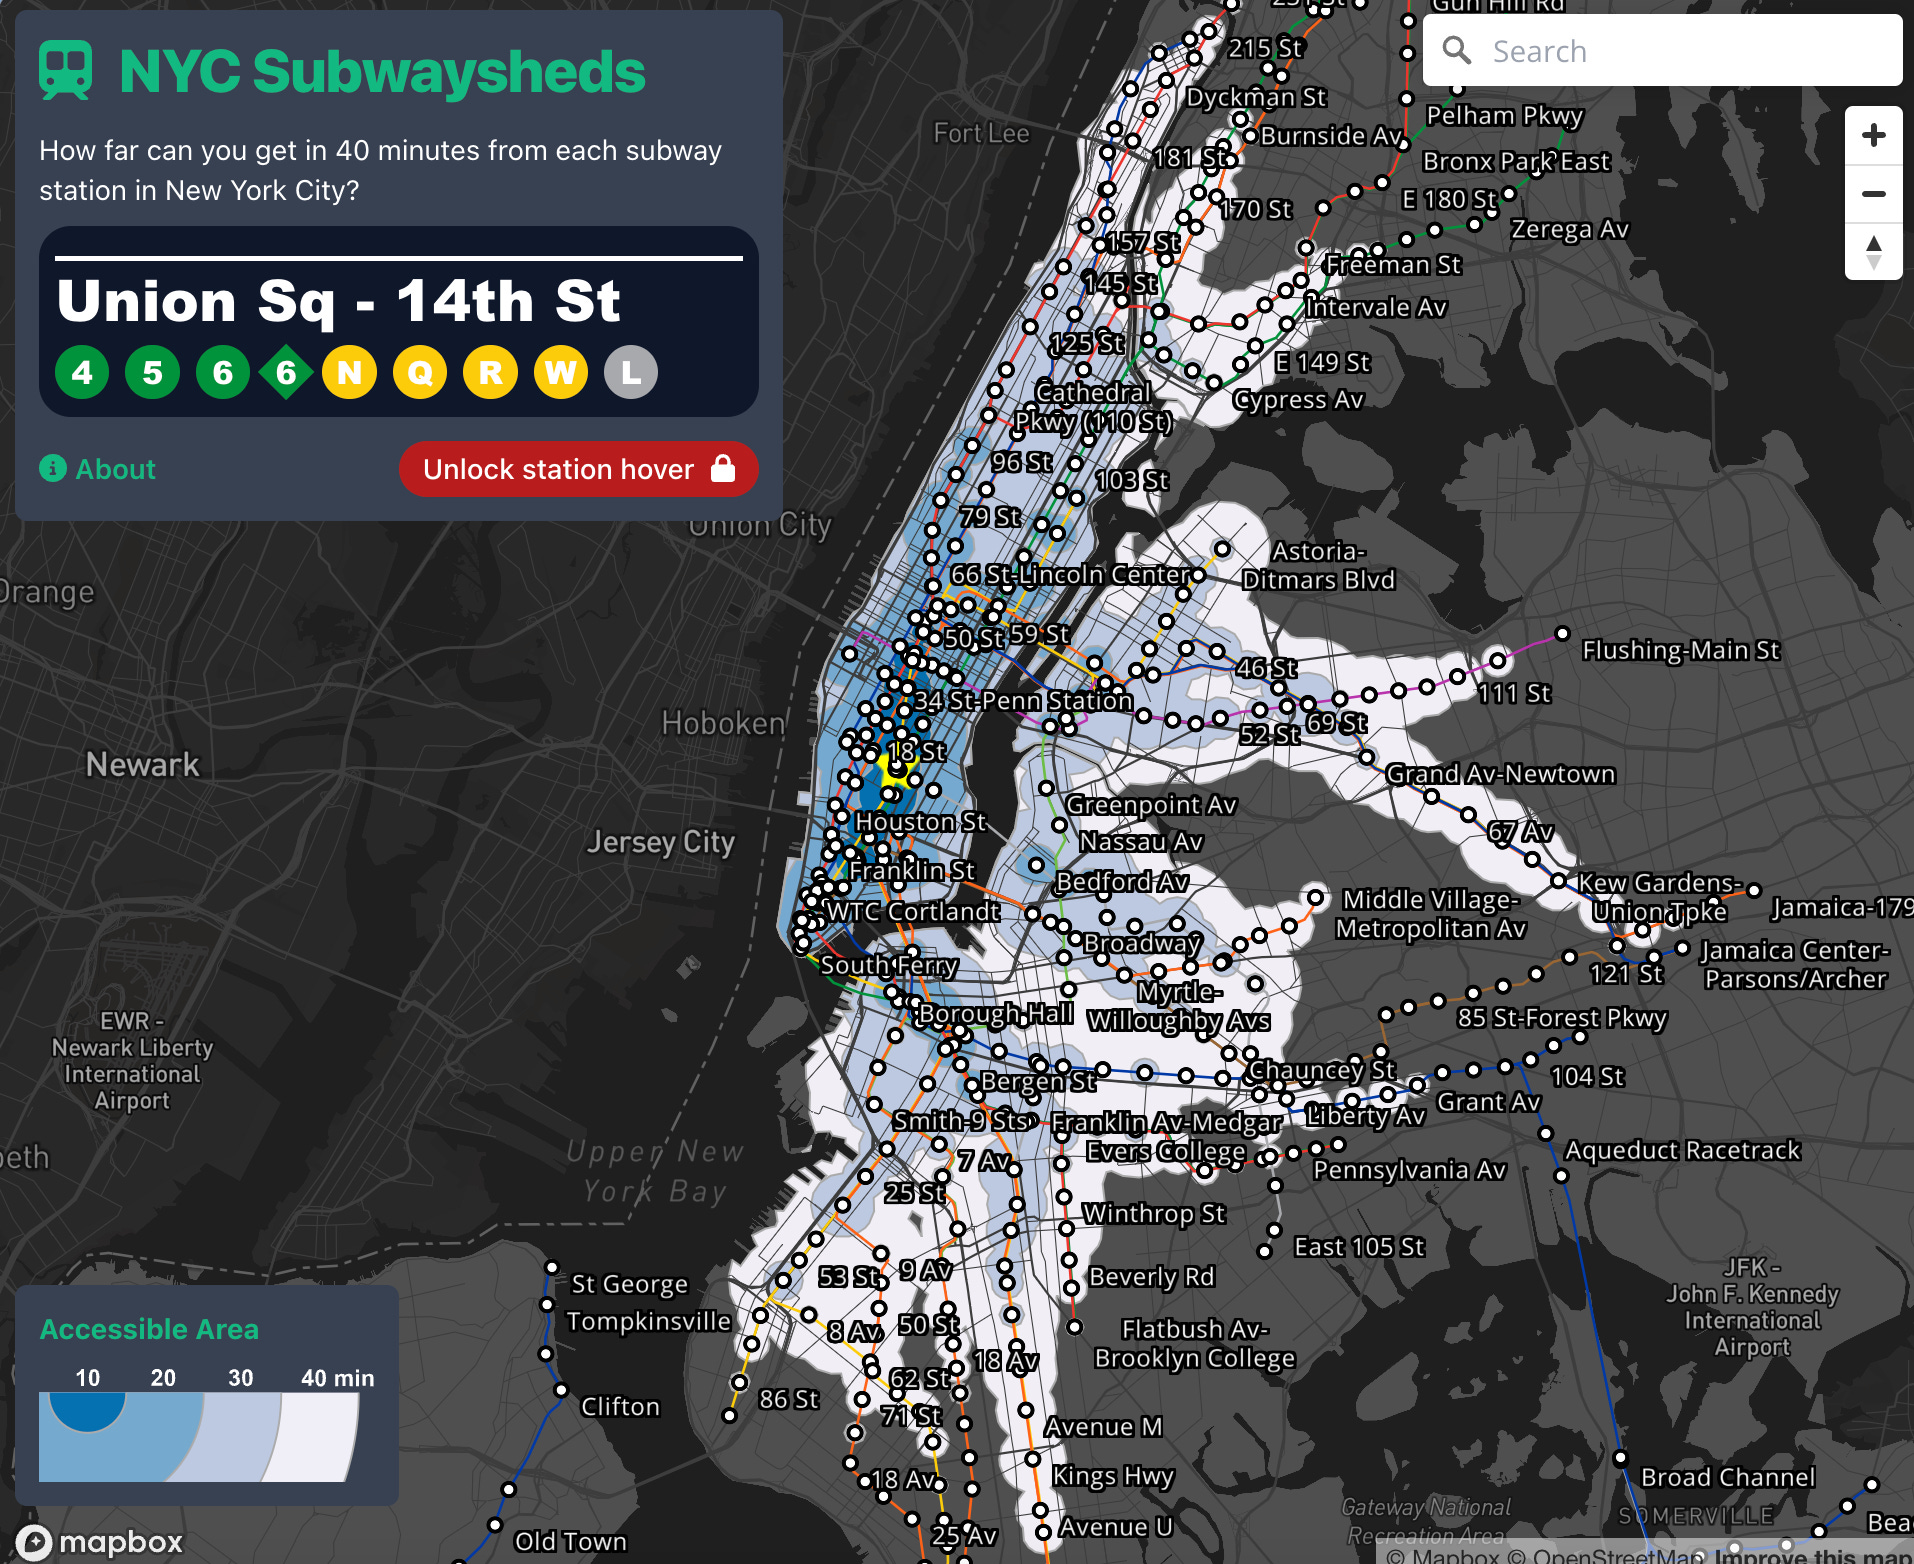
This project lets you see how far you can get in 40 minutes from each of NYC’s 472 subway stations. It is made with NYC’s GTFS file (a widely-used standardized transit time reporting format) and gtfsrouter in R. As the About section says, this map attempts to start a conversation between itself and the user: what new places of NYC do you want to explore now that you have a potential duration for your trip? More broadly, maps of this type are important for giving some context and clarity to help conversations of transit access, such as being able to analyze what neighborhoods are currently underserved by the subway.
TravelTime: Solving problems with search
Isochrones have a ton of other cool and broader applications as well. TravelTime API is an example of a company doing interesting work in this area. In their recent talk at Berlin Buzzwords 2023, they talked about their collaboration with the NHS to provide people accurate travel directions when they needed COVID-19 testing. The talk:
For some more context, TravelTime offers routing, isochrones and travel time matrices for a variety of applications. In this talk, Chris Hutchinson discusses how they addressed the question of how to match a search with the best available test as people were looking to go to testing centers for a COVID test. There were a couple of key requirements, such as finding routing directions for driving as a travel mode, requirement for high performance (computing a route in only a few seconds) and preserving users’ privacy in the process. The core model they use for this (and the rest of uses) is trained on a lot of transport data to predict driving times. Towards the end, he also gets to other healthcare applications like planning, e.g. where new emergency centers can be built or how they account for cycling conditions and terrain when they make biking-specific maps or even multi-modal transportation.
Conclusion
This issue took the established concept of isochrones and delved into how they are being used together with emerging data and modeling techniques in new and exciting applications. From NYC Subway sheds to routing people looking for COVID testing to developing metrics that measure nuances in walking behavior, isochrones and their uses are all around us.
I hope you enjoyed this issue and thanks for reading!